Ticket #2156 (closed)
Provide equivalent of COLETTE DISPLAY/SPECIAL plot transformations
| Reported by: | Nick Draper | Owned by: | Russell Taylor |
|---|---|---|---|
| Priority: | critical | Milestone: | Iteration 27 |
| Component: | Mantid | Keywords: | |
| Cc: | stephen.king@… | Blocked By: | |
| Blocking: | Tester: | Nick Draper |
Description (last modified by Nick Draper) (diff)
see change history
Attachments
Change History
comment:1 Changed 10 years ago by Nick Draper
- Priority changed from major to critical
- Description modified (diff)
comment:2 Changed 10 years ago by Nick Draper
Provide a number of plots of reduced data with altered axes.
Two mockups created in Mockups\SANS Display-plotting.bmml and Display-plotting_general.bmml
On clicking plot we should create the workspace and a suitable plot.
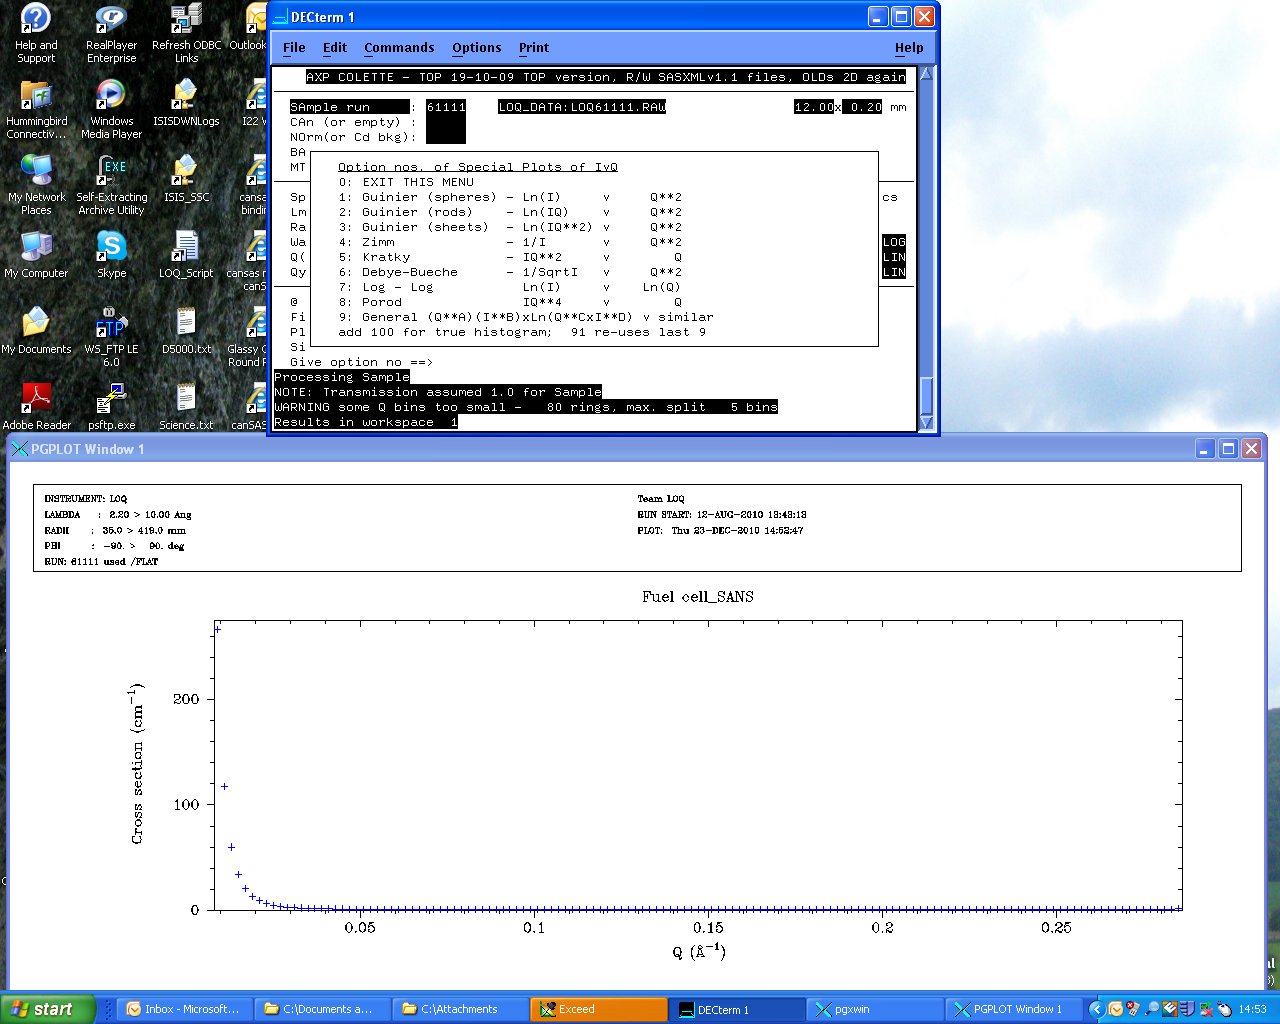
**Reduced** data transformations available in COLETTE (also see attachments) and desired in Mantid are:

    1: Guinier (spheres) - Ln(I)     v     Q**2
    2: Guinier (rods)    - Ln(IQ)    v     Q**2
    3: Guinier (sheets)  - Ln(IQ**2) v     Q**2
    4: Zimm              - 1/I       v     Q**2
    5: Kratky            - IQ**2     v        Q
    6: Debye-Bueche      - 1/Sqrt(I) v     Q**2
    7: Log-Log           - Ln(I)     v    Ln(Q)
    8: Porod             - IQ**4     v        Q
    9: General           - (Q**A)(I**B) x Ln(Q**C x I**D x E) v (Q**F)(I**G) x Ln(Q**H x I**I x J)
   91: re-uses last 9

A background to be subtracted from the data **before** transformation may also be specified (default is 0.0). This can take the form of a constant **or another workspace!**.

Note that Log-Log transformation no.7 is logarithmic numbers on linear axes (as distinct from the usual plotting option in COLETTE or Mantid of linear numbers on logarithmic axes).

These transformations need to be user-selectable and the output needs to be in a workspace that can be plotted, written to file, **and fitted to a straight line over some user-selected range of X with the gradient & intercept +/- errors displayed in the results log**.

The argument to the Fortran get_special function is a COLETTE/GENIE-II workspace number.
comment:3 Changed 10 years ago by Nick Draper
- Description modified (diff)
adding attachments of how this was done in collete
comment:5 Changed 10 years ago by Nick Draper
- Status changed from new to assigned
- Owner changed from Sofia Antony to Russell Taylor
comment:6 Changed 10 years ago by Nick Draper
Significant changes made to mockups in the documents\design\mckups\sans directory
The general form should bring vreate text boxes for the user to input the variables.
See also ticket #2197
comment:10 Changed 10 years ago by Nick Draper
- Milestone changed from Iteration 27 to Iteration 28
Bulk move of tickets at the end of iteration 27
comment:11 Changed 10 years ago by Russell Taylor
- Status changed from accepted to verify
- Resolution set to fixed
- Milestone changed from Iteration 28 to Iteration 27
I'm going to close this now so that the algorithm part can be tested and create a separate ticket for the gui part (for the next iteration). This could be used now in conjunction with native Mantidplot plotting and fitting, but we will provide a 'nicer' way.
comment:12 Changed 10 years ago by Sofia Antony
- Status changed from verify to verifying
- Tester set to Sofia Antony
comment:13 Changed 10 years ago by Sofia Antony
- Status changed from verifying to reopened
- Resolution fixed deleted
Russell,
I've used LOQ48098.raw reduced workspace to test this and the workspace data after applying this transformations are not correct.Will be sending you a detailed mail.
Thanks, Sofia
comment:15 Changed 10 years ago by Nick Draper
- Status changed from verify to verifying
- Tester changed from Sofia Antony to Nick Draper
comment:17 Changed 10 years ago by Russell Taylor
Ticket for the GUI part is #2420.
comment:18 Changed 5 years ago by Stuart Campbell
This ticket has been transferred to github issue 3003