Ticket #4166 (closed: fixed)
Add Optional plotWindow option to PlotStectrum + plotBin
| Reported by: | Nick Draper | Owned by: | Arturs Bekasovs |
|---|---|---|---|
| Priority: | major | Milestone: | Release 3.1 |
| Component: | Python | Keywords: | |
| Cc: | Blocked By: | ||
| Blocking: | #8349 | Tester: | Martyn Gigg |
Description
This will allow plotting to an existing window if provided
Attachments
Change History
comment:2 Changed 9 years ago by Nick Draper
- Milestone changed from Iteration 32 to Iteration 33
Moved to iteration 33 at iteration 32 code freeze
comment:3 Changed 8 years ago by Nick Draper
- Milestone changed from Release 2.1 to Release 2.2
Moved at end of release 2.1
comment:4 Changed 8 years ago by Nick Draper
- Milestone changed from Release 2.2 to Release 2.3
Moved at the end of release 2.2
comment:5 Changed 8 years ago by Nick Draper
- Milestone changed from Release 2.3 to Release 2.4
Moved to milestone 2.4
comment:8 Changed 7 years ago by Martyn Gigg
- Milestone changed from Release 2.6 to Release 2.7
Batch move to 2.7
comment:10 Changed 7 years ago by Martyn Gigg
- Owner changed from Martyn Gigg to Arturs Bekasovs
This is now required by the Muon work. I have shows Arturs the areas that will need modifying.
comment:12 Changed 7 years ago by Arturs Bekasovs
- Blocking 8349 added
comment:13 Changed 7 years ago by Arturs Bekasovs
- Status changed from new to inprogress
Refs #4166. Added a window argument for plotSpectrum.
Argument to clear that window was added as well, but is not working yet.
Changeset: 2a42344325b0222191229b0bffbb779dfc30abc2
comment:14 Changed 7 years ago by Arturs Bekasovs
Refs #4166. Updated documentation.
Changeset: b82508cca3ebd806fc4e79330f219471e63152fe
comment:15 Changed 7 years ago by Arturs Bekasovs
Refs #4166. Make clearWindow argument work.
Additionally, made it add the curves even if specified window doesn't have any layers.
Changeset: 0fcb06b188e475ef8de136716247db848d245992
comment:16 Changed 7 years ago by Arturs Bekasovs
Refs #4166. Refactored plotBin.
So I have control over curve adding process.
Changeset: 6c8ac972c8029932e0df584160c2baa75119811a
comment:17 Changed 7 years ago by Arturs Bekasovs
Refs #4166. New argument for plotBin.
Plus some documentation updates.
Changeset: b397a9fd69882004a86c35672d8fe043ed137546
comment:18 Changed 7 years ago by Arturs Bekasovs
Refs #4166. Make argument for plotBin work.
Changeset: ce9f9b29f00f741b4e8b01f81275fd273bef16ab
comment:19 Changed 7 years ago by Arturs Bekasovs
Refs #4166. Refactoring.
Created a function to do all the MultiLayer preparation stuff.
Changeset: 8901ad54c2b10e51375cd55a0f79840d3b873dc7
comment:20 Changed 7 years ago by Arturs Bekasovs
Refs #4166. New arguments for plotMD.
Changeset: a4309c3fff948b430eb5dfabef5f7fb1023381ee
comment:21 Changed 7 years ago by Arturs Bekasovs
Refs #4166. Fixed the problem with plotMD IPython doc pop-up.
It wasn't able to display the default value of normalization correctly and thrown an error. I will make further investigation into why IPython fails to do so, but this quick fix seems to solve the problem which is fine for this ticket.
Changeset: 1891650e37654135e6459741dae8739001266995
comment:22 Changed 7 years ago by Arturs Bekasovs
Refs #4166. Added window name parameter to helper function.
All the plotting functions were specifying it afterwards anyway.
Changeset: b9f20e66cd4e28823ebd75ab71a80c5e7439b028
comment:23 Changed 7 years ago by Arturs Bekasovs
Refs #4166. Logic for new arguments of plotMD.
Changeset: bda5949748f1c563149952d6a10f7f8d9945037d
comment:24 Changed 7 years ago by Arturs Bekasovs
Refs #4166. Some code to made plot functions consistent.
Seemed to work without it, but it feels safer this way.
Changeset: 5a90eb944855fcac7e390c33d3fc1ba31a2085f7
comment:25 Changed 7 years ago by Arturs Bekasovs
Refs #4166. Documentation for plotMDList.
Changeset: 722f53a2cdf53108b4592c05212332c34777bae4
comment:26 Changed 7 years ago by Arturs Bekasovs
Tester:
Apart from plotSpectrum and plotBin specified in the description, I've added required functionality to plotMD as well, as requested by Owen.
Two arguments were added to all three functions - window and clearWindow.
Documentation
First of all, please launch MantidPlot, open IPython console and by typing e.g. "plotSpectrum(" check that documentation pop-up is clear describing what new arguments are for. I've had some problems with that pop-up, so please check that for all 3 functions.
plotSpectrum
Load some sample workspace, e.g. emu00006473.
Check that is works correctly with default arguments:
w = plotSpectrum('emu00006473', 0)
New window should be created, with a single curve in it. Check that window and graph titles are set correctly.
Now check that window argument works:
plotSpectrum('emu00006473', [1,2,3], window = w)
Three curves should be added to the existing plot window. Make sure line colors are different and plot legend is updated accordingly. Window should not be moved or re-sized.
Check that clearWindow argument works:
plotSpectrum('emu00006473', 4, window = w, clearWindow = True)
All the previous curves should be removed, and a single one should be added.
Experiment with changing parameters and verifying that is does what you expect.
Now, focus on the graph window and click Graph -> Add Layer -> Guess. A new layer should be added on the right. Now, by changing the active layer using selector on the graph's top-left corner, run:
plotSpectrum('emu00006473', 1, window = w)
and make sure a new curve is added to the currently active layer. When plotting to the second (manually created) layer, legend or title should not be created and axis labels should not be changed. This is because when clearWindow is False and we do specify a window, we should not change any of the window's parameters. Axis might get re-scaled though, to fit a new curve.
Then, run
plotSpectrum('emu00006473', 1, window = w, clearWindow = True)
and make sure that only a single layer is left with a single curve in it. The size of the graph window shouldn't change.
plotBin
Basically, check it in the same way plotSpectrum was checked, but using
plotBin('emu00006473', 0)
instead.
emu00006473 could be used here as well.
There are two drawbacks in here I am aware of:
- Tables are created when plotting. That's the way plotBin works (and, as Martyn explained, the way plotSpectrum was working previously). It will be fixed in #6517, but for now have to live with that.
- Color of the lines is incorrect. This wasn't introduced in this ticket, and will be solved in #8417.
plotMD
Same checks, but using
plotMD('binned', 0)
To create binned MD workspace (as specified in #8183 pointed to by Owen):
slice2d = CreateMDWorkspace(Dimensions=2,EventType='MDEvent',Extents='-10,10,-10,10',Names='Q, P',Units='A,A')
FakeMDEventData(InputWorkspace=slice2d,UniformParams='1000',PeakParams='1000,0,0,0.5')
binned = BinMD(InputWorkspace=slice2d,AlignedDim0='Q,-10,10,100',AlignedDim1='P,-1,1,1',OutputWorkspace='binned')
Another good thing to check here might be the following scenario, which makes sure that if curve is added to the existing plot, axis are not re-scaled. (Additionally, it shows why the feature can actually be useful. :-)
- Two plots: same curve, different axis:
plotMD('binned', 0, normalization = 1)
plotMD('binned', 0, normalization = 0)
- One plot: same axis, different curves, so you can compare them on the same scale:
w = plotMD('binned', 0, normalization = 1)
plotMD('binned', 0, normalization = 0, window = w)
comment:27 Changed 7 years ago by Arturs Bekasovs
Refs #4166. Fixed compiler warning - uninitialized value.
Changeset: e36c2db5081ea758674c2567f373bd558bb7c474
comment:28 Changed 7 years ago by Arturs Bekasovs
- Status changed from inprogress to verify
- Resolution set to fixed
comment:29 Changed 7 years ago by Martyn Gigg
- Status changed from verify to verifying
- Tester set to Martyn Gigg
comment:30 Changed 7 years ago by Martyn Gigg
- Status changed from verifying to reopened
- Resolution fixed deleted
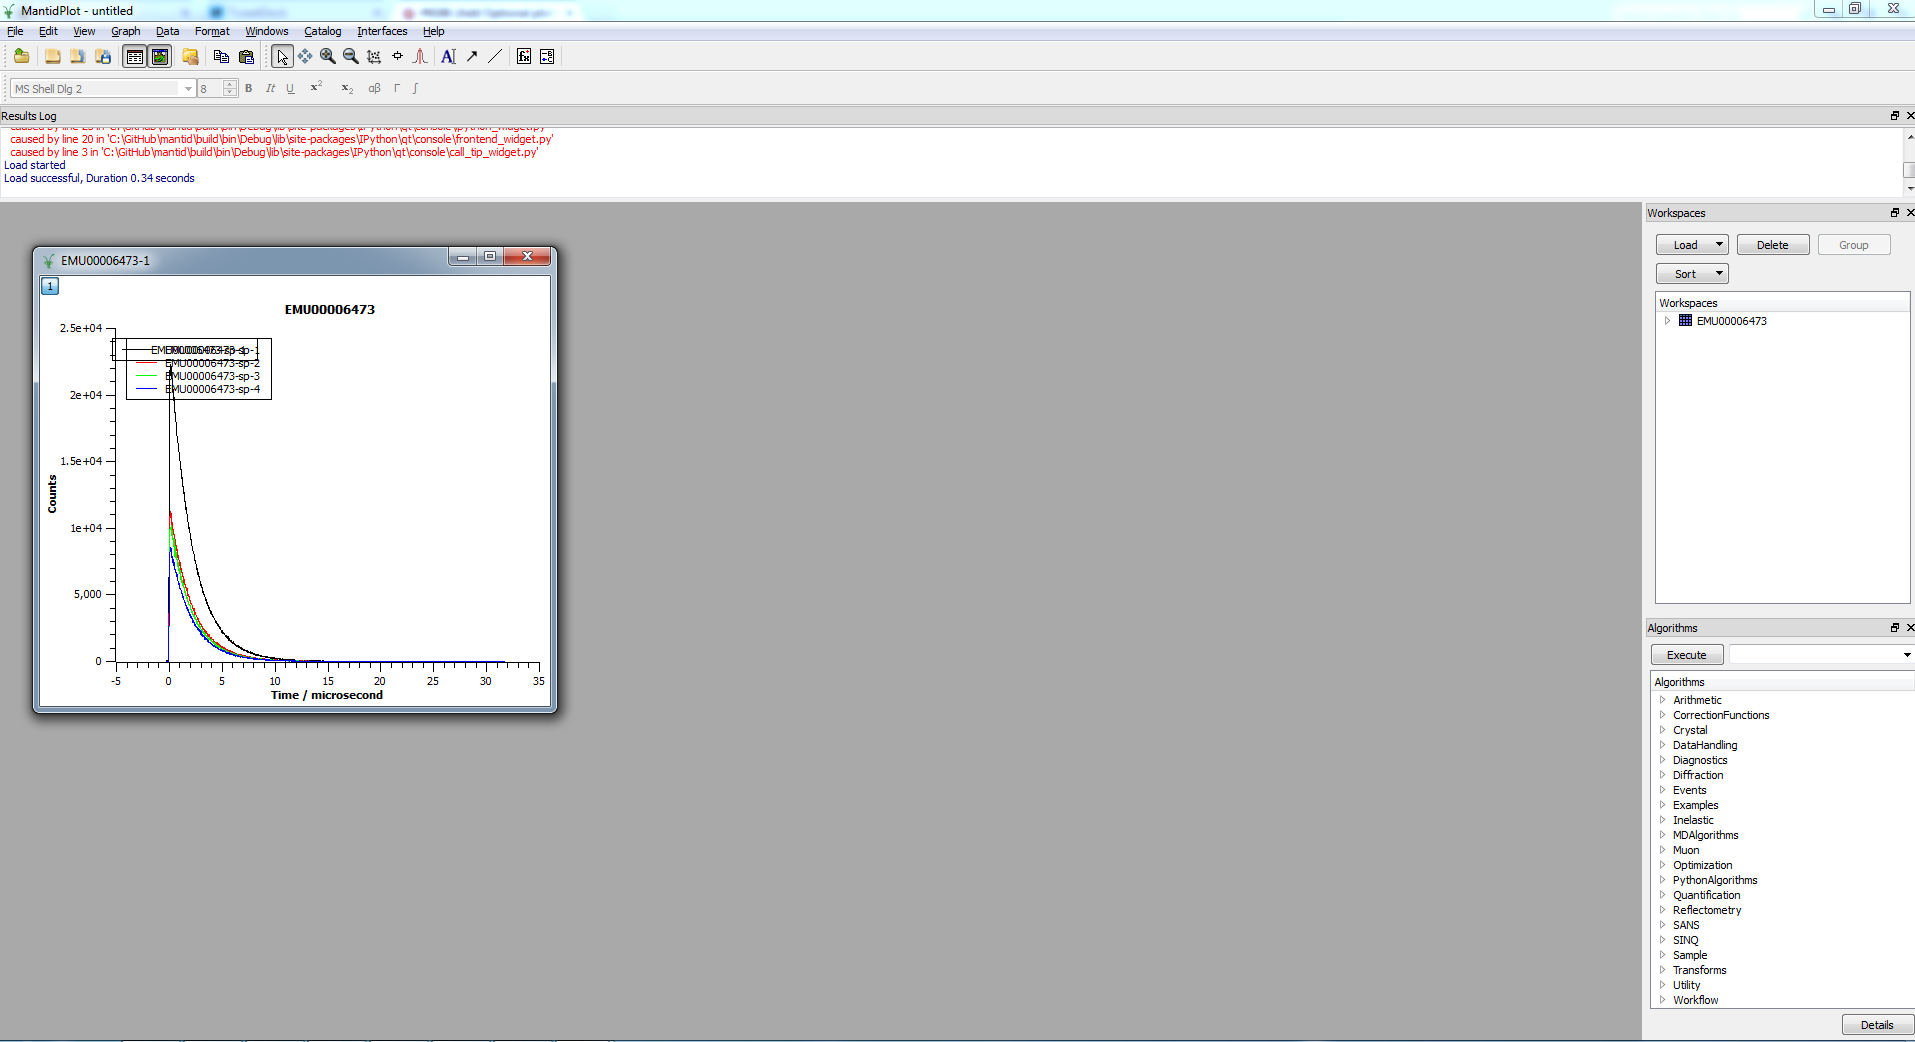
All of the commands do behave as expected but there seems to be something funny happening with the legend. I've attached a plot that is the result of the first two plotSpectrum commands.
You can see that a new legend has been created and sits on top of the original. If I move the second one out of the way then I can still interact with the first so it's real not an artifact.
comment:31 Changed 7 years ago by Arturs Bekasovs
- Status changed from reopened to inprogress
Refs #4166. Initialize isNew.
This caused problems in Windows, as apparently default value was different, and is safer in general.
Changeset: e155a3d3e48594a5bd38d1115a85f1d319d03ad6
comment:32 Changed 7 years ago by Arturs Bekasovs
- Status changed from inprogress to verify
- Resolution set to fixed
comment:34 Changed 7 years ago by Martyn Gigg
That seems to have solved the multiple legend problem.
comment:35 Changed 7 years ago by Martyn Gigg
- Status changed from verifying to closed
Merge remote-tracking branch 'origin/feature/4166_plot_spectrum_window_param'
Full changeset: 732fea47b51df3286adb1e1eef76bae91012fe6c
comment:36 Changed 5 years ago by Stuart Campbell
This ticket has been transferred to github issue 5013
I'm going to be working almost exclusively in this area in the coming weeks, and this ticket overlaps with that (see for example #2656) so it might make sense to hand this over to me unless it's super-urgent.