Ticket #11348 (closed: fixed)
Potential problems with error bars during BinMD/SliceMD
| Reported by: | Owen Arnold | Owned by: | Owen Arnold |
|---|---|---|---|
| Priority: | major | Milestone: | Release 3.5 |
| Component: | Framework | Keywords: | VATES-bug |
| Cc: | Blocked By: | ||
| Blocking: | Tester: | Martyn Gigg |
Description
- Need instrument scientist test cases, Some idea of how much off the error bars are would be useful.
- Will need to drill down into the code and find the offending parts
- Will need to fix, and test
- May need to update system tests
Could be 1-2 dedicated and uninterrupted man weeks as I have no idea how deep the problem goes.
Attachments
Change History
comment:1 Changed 6 years ago by Nick Draper
- Status changed from new to assigned
- Owner changed from Anyone to Alex Buts
- Milestone changed from Backlog to Release 3.4
comment:3 Changed 6 years ago by Alex Buts
- Status changed from assigned to inprogress
Let's run the Mantid script
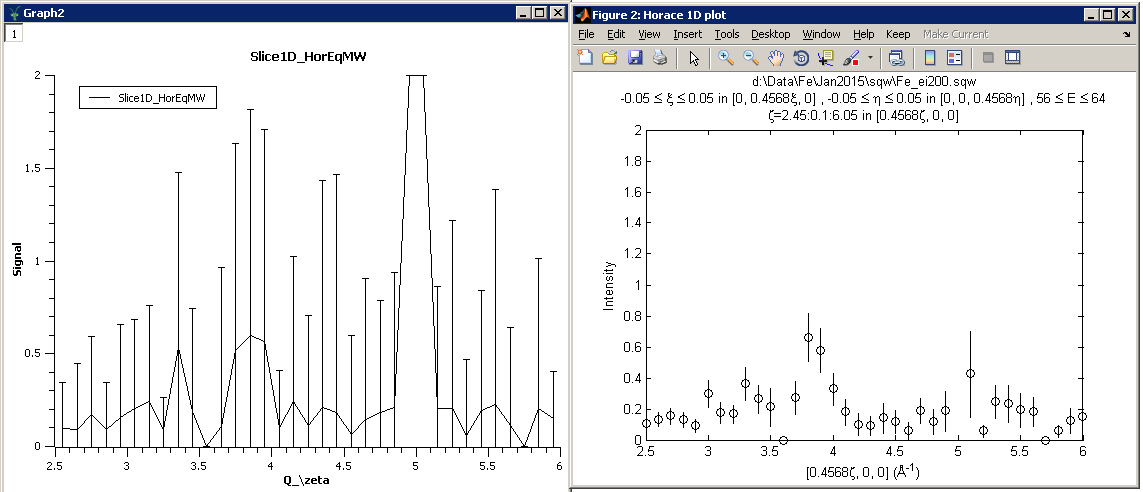
Load(Filename=r'D:\Data\Mantid_Training\sqw\fe_E200_8K.nxs', OutputWorkspace='fe_E200_8K', FileBackEnd=True)
BinMD(InputWorkspace='fe_E200_8K', AlignedDim0=r'Q_\zeta,2.5,6,35', AlignedDim1=r'Q_\xi,-0.05,0.05,1', AlignedDim2=r'Q_\eta,-0.05,0.05,1', AlignedDim3='E,56,64,1', OutputWorkspace='Slice1D_HorEq')
ConvertMDHistoToMatrixWorkspace(InputWorkspace='Slice1D_HorEq', OutputWorkspace='Slice1D_HorEqMW', Normalization='NumEventsNormalization')
and Horace Script:
cd d:\Data\Fe\Jan2015\sqw
data='Fe_ei200.sqw'

proj.u=[1,0,0];
proj.v=[0,1,0];
proj.w=[0,0,1];
proj.type='aaa'
w1 = cut_sqw(data,proj,[2.5,0.1,6],[-0.05,0.05],[-0.05,0.05],[56,64]);
plot(w1)
Which should in theory produce equivalent 1D cuts.
The cuts in fact have different signal intensity and error bars.
The differences in the signal intensity can be remedied by disabling division by bin width.
It is the question if settings for division by bin width should be set up separately for VATES and other Mantid graphics.
The job is ongoing to produce simple interface returning the same X-axis for the same Matlab(Horace) and Mantid settings. (At the moment it is slightly different)
The "Raw" non-normalized data, for HORACE calculated by formula:
>> senn=[wss.data.s.*wss.data.npix,sqrt(wss.data.e.*wss.data.npix.*wss.data.npix),wss.data.npix,xx]
and for Mantid (printed by "MDworkspace->ShowData)
are provided in the table below. Despite the difference is not that big (though significant) taking square root of each errors and dividing by number of pixels yields the errors which are substantially different (see the picture, provided).
Horace uses in its signal calculations the formula Error = sqrt(Sum_i(Error_i2)/Npix2), where Mantid uses the formula Error=sqrt(Sum_i(Error_i2))/Npix where Npix is the number of pixels or MDEvents correspondingly, contributing into a bin(box in MD Case), and i runs over all contributing pixels(MDEvents). This should produce equivalent results.
It is certainly something wrong in deriving boxes or errors within them and combining these errors together.
The source data used in comparison can be found in local ISIS network, on Windows share (read-only):
\\ndw932\Data

at:
/Mantid_Training/sqw/fe_E200_8K.nxs
and:
/Fe/Jan2015/sqw/Fe_ei200.sqw
              MANTID                                                 HORACE
Signal/none, Error/none, Number of Events, Q_\zeta/A^(-1)   S         ERR      Npix         X
34.367,      87.8992,   353,                2.55,         41.5840   15.6798  387.0000    2.5000
25.8617,     98.2287,   276,                2.65,         53.4698   18.1446  396.0000    2.6000
51.2623,     123.872,   295,                2.75,         54.2098   19.3196  349.0000    2.7000
22.0102,     61.1029,   242,                2.85,         39.8240   15.1565  301.0000    2.8000
32.7581,    103.796,    208,                2.95,         23.3670   10.9993  251.0000    2.9000
46.3524,    108.549,    226,                3.05,         73.9370   21.6282  246.0000    3.0000
41.7758,    90.119,     174,                3.15,         35.8560   14.9035  202.0000    3.1000
14.5093,    28.2076,    162,                3.25,         34.4770   12.3020  203.0000    3.2000
93.6789,    166.658,    176,                3.35,         67.7810   20.7722  186.0000    3.3000
27.1168,    81.1124,    145,                3.45,         48.9164   17.0641  183.0000    3.4000
0,          0,          12,                 3.55,         19.1870   11.2196   90.0000    3.5000
8.08198,    65.3184,    76,                 3.65,               0         0   16.0000    3.6000
71.8032,    155.054,    139,                3.75,         36.4220   14.4774  133.0000    3.7000
74.3665,    150.923,    124,                3.85,        119.5766   28.0023  180.0000    3.8000
76.3163,    154.117,    135,                3.95,         96.9460   24.5746  167.0000    3.9000
12.7918,    38.1311,    124,                4.05,         54.0310   17.8980  164.0000    4.0000
28.164,     90.4263,    116,                4.15,         26.6180   12.6205  147.0000    4.1000
14.6473,    75.853,     128,                4.25,         15.0150   10.6202  147.0000    4.2000
25.6522,    150.796,    123,                4.35,         14.4070   10.1887  154.0000    4.3000
20.666,     143.573,    112,                4.45,         19.6580   13.5619  136.0000    4.4000
8.20426,    67.3099,    126,                4.55,         15.3190    9.6809  127.0000    4.5000
14.3736,    73.2492,    97,                 4.65,          6.9690    6.9690  116.0000    4.6000
21.32,      71.4531,    118,                4.75,         29.1350   13.0996  155.0000    4.7000
26.1621,    90.8816,    125,                4.85,         13.7520    9.7243  115.0000    4.8000
0,          0,          0,                  4.95,         14.3530   10.1559   76.0000    4.9000
0,          0,          0,                  5.05,               0         0         0    5.0000
23.2047,    73.4144,    112,                5.15,         15.3650   10.0536   36.0000    5.1000
13.9652,    69.0381,    68,                 5.25,          7.3400    5.1941  125.0000    5.2000
6.8496,     46.9171,    114,                5.35,         34.7720   15.5538  140.0000    5.3000
20.1854,    67.5384,    104,                5.45,         20.2640   10.6116   87.0000    5.4000
14.4746,    74.097,     64,                 5.55,         21.9690   12.6859  112.0000    5.5000
11.891,     54.9741,    104,                5.65,         18.9900   10.0134  104.0000    5.6000
0,          0,          94,                 5.75,               0         0   76.0000    5.7000
14.4482,    56.6009,    70,                 5.85,          7.1240    5.0888  122.0000    5.8000
16.4749,    27.5568,    109,                5.95,         13.0280    8.6826  103.0000    5.9000
                                                          14.7320    7.5089   96.0000    6.0000
comment:5 Changed 5 years ago by Nick Draper
- Milestone changed from Release 3.4 to Release 3.5
Moved to R3.5 at the R3.4 code freeze
comment:6 Changed 5 years ago by Owen Arnold
From email to Alex, Russell, Toby and Andrei
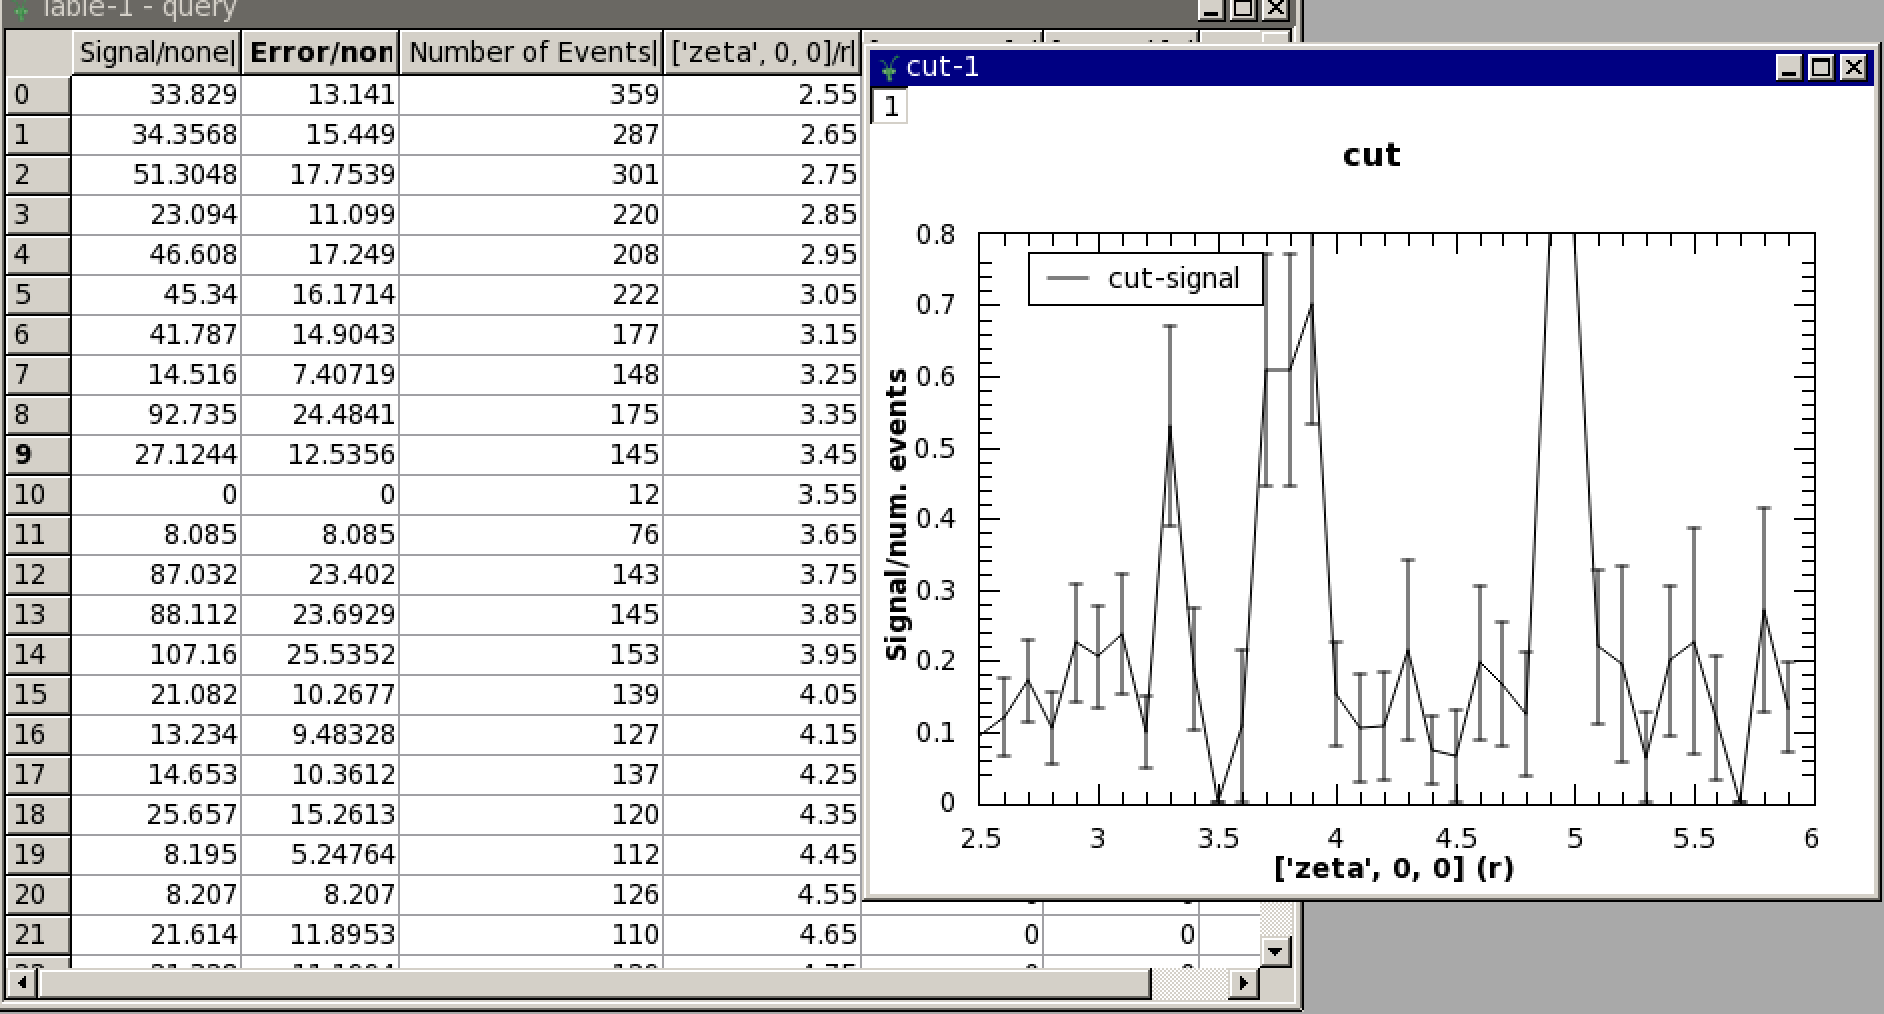
Hi All,

I've been doing some digging, and went and looked at the original sqw file. I noticed that in Mantid, when we load the SQW file the errors are very large prior to rebinning or plotting. I'm wondering if the cause of this issue is because we are incorrectly reading errors out of the SQW binaries in the first place? Are the errors stored as errors^2 in the binary rather than error?

Andrei and I have both re-checked the plotting normalization and the rebinning, and we can't find any problems. However, if I change https://github.com/mantidproject/mantid/blob/master/Code/Mantid/Framework/MDAlgorithms/src/LoadSQW.cpp#L279 to give errorSQ, then when I process the file in Mantid according the the script Alex provided (script attached), the errors look realistic. Below is the plot and the results from QueryMDWorkspace on the cut.

I don't know the SQW format very well, so I'm not completely confident in saying that this is the fix we need. Advice would be appreciated.

Regards,
Owen.
Results generated using this script:
from mantid.api import MDNormalization
data = Load("Fe_ei200.sqw")
cut = CutMD(data,NoPix=True,PBins=[[2.5,0.1,6],[-0.05,0.05],[-0.05,0.05],[56,64]])
plotMD(cut, normalization=MDNormalization.NumEventsNormalization)
See attached output
Response From T. Perring:
The data in the sqw file contains the variance i.e. error squared.
This looks to be the fix needed.
comment:7 Changed 5 years ago by Owen Arnold
refs #11348. Apply the fix.
The algorithm documentation for this algorithm is actually up-to-date correctly pointing out that the file stores the variance. The fix brings the implementation in-line.
Changeset: ef19a200f3f703562e393f13049cadd39c822158
comment:8 Changed 5 years ago by Owen Arnold
- Status changed from inprogress to verify
- Resolution set to fixed
This is being verified as pull request #691.
comment:9 Changed 5 years ago by Martyn Gigg
- Status changed from verify to verifying
- Tester set to Martyn Gigg
comment:10 Changed 5 years ago by Martyn Gigg
- Status changed from verifying to closed
Merge pull request #691 from mantidproject/11348_error_bars
Problems with Error Bars
Full changeset: b036f5cdc459b5ed995f1736d0a895be1c511a67
comment:11 Changed 5 years ago by Stuart Campbell
This ticket has been transferred to github issue 12187
Alex,
Can you create a Horace/vates comparison for an available dataset and specific slices that show the error bar discrepancy.
Than hand this on to Owen or Andre