Ticket #5653 (closed: fixed)
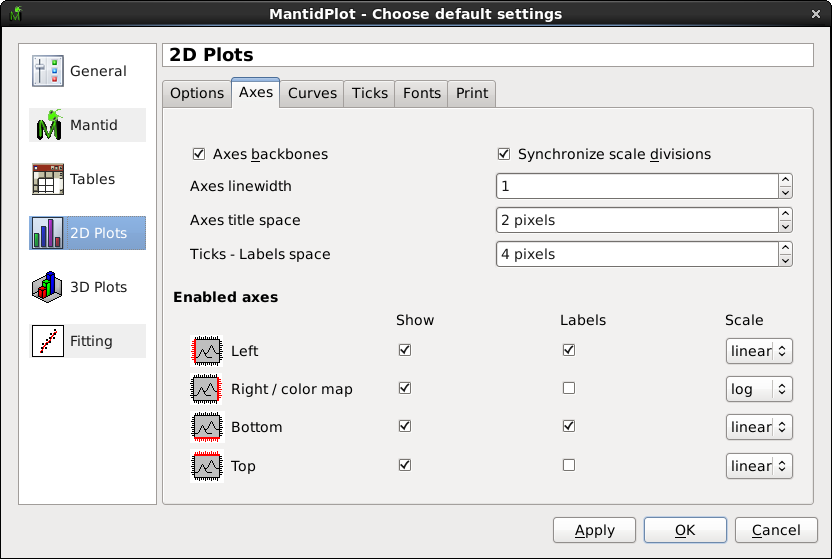
Pull in the current QtiPlot Plot2d/Axes tab from the preferences dialog
| Reported by: | Russell Taylor | Owned by: | Russell Taylor |
|---|---|---|---|
| Priority: | major | Milestone: | Release 2.2 |
| Component: | MantidPlot | Keywords: | |
| Cc: | Blocked By: | ||
| Blocking: | Tester: | Andrei Savici |
Description
There's been a request for it to be possible to have preference such that all axes are shown on plots (already there) but the axis labels are not for the top & right axes. This is available in today's QtiPlot ConfigDialog so the best thing is just to pull that in (keeping the log/linear preference that we've added to it).
Attachments
Change History
comment:2 Changed 8 years ago by Russell Taylor
Re #5653. Pull in current QtiPlot 2d plots/axes preferences dialog.
Allows greater control. Just a bit left to do on loading/saving preferences and color fill plot behaviour.
Changeset: 0e3d74325f7973a87eb6e6475204d6c3503a4d38
comment:3 Changed 8 years ago by Russell Taylor
Re #5653. Tweaks to get spectrogram plots behaving.
Changeset: e417b712758e109287d2013fa02552ea302d2da4
comment:4 Changed 8 years ago by Russell Taylor
Re #5653. All new settings are now saved and reloaded.
Also transforms from the old 'AllAxes' setting to the new per-axis settings the first time a build containing this code is run.
Changeset: b4056b76118bf1df7e01e22db3a264eb52cfbb10
Changed 8 years ago by Russell Taylor
- Attachment PlotSettings.png added
The new plot2d - axes preferences panel
comment:5 Changed 8 years ago by Russell Taylor
- Status changed from accepted to verify
- Resolution set to fixed
comment:6 Changed 8 years ago by Russell Taylor
Re #5653. Pull in current QtiPlot 2d plots/axes preferences dialog.
Allows greater control. Just a bit left to do on loading/saving preferences and color fill plot behaviour.
Changeset: 0e3d74325f7973a87eb6e6475204d6c3503a4d38
comment:7 Changed 8 years ago by Russell Taylor
Re #5653. Tweaks to get spectrogram plots behaving.
Changeset: e417b712758e109287d2013fa02552ea302d2da4
comment:8 Changed 8 years ago by Russell Taylor
Re #5653. All new settings are now saved and reloaded.
Also transforms from the old 'AllAxes' setting to the new per-axis settings the first time a build containing this code is run.
Changeset: b4056b76118bf1df7e01e22db3a264eb52cfbb10
comment:9 Changed 8 years ago by Andrei Savici
- Status changed from verify to verifying
- Tester set to Andrei Savici
comment:10 Changed 8 years ago by Andrei Savici
- Status changed from verifying to closed
works as described
comment:11 Changed 5 years ago by Stuart Campbell
This ticket has been transferred to github issue 6499

