Ticket #6211 (closed: fixed)
PeakRadius in ParaView PeaksWorkspace Overlay
| Reported by: | Owen Arnold | Owned by: | Owen Arnold |
|---|---|---|---|
| Priority: | major | Milestone: | Release 2.4 |
| Component: | VATES | Keywords: | |
| Cc: | Blocked By: | #6215 | |
| Blocking: | Tester: | Michael Reuter |
Description
We currently have functionality for showing a PeaksWorkspace in vtk/paraview. New ISIS SX requirements are to show the 'FootPrint' of the peak integration as an overlay. The simplest way to realise this functionality would be to extend the existing ParaView plugins to support this feature.
The way I see this working would be to:
- Change the glyph type to a sphere
- Control the size of the glyph using the integration 'PeakRadius'
As a side note, it would be good to be able to show the background radius too, but i'm not sure how well this would work out in 3D.
Getting this right, would be a good first-step to rolling out #5167.
Attachments
Change History
comment:2 Changed 8 years ago by Owen Arnold
refs #6211. Extract and pass through peak radius.
Changeset: ef50e80b04969bde79adc2895a9ad70691c9f53a
comment:3 Changed 8 years ago by Owen Arnold
refs #6211. PV Plugins use Integrated Radius and show Spheres.
Changeset: 167f78b20f1522acedff63f69b761d23b104755e
comment:5 Changed 8 years ago by Owen Arnold
- Status changed from accepted to verify
- Resolution set to fixed
comment:6 Changed 8 years ago by Owen Arnold
Tester:
1) Run the python script below (taken from Diffraction_Workflow_Test.py system test).
2) Using the VSI http://www.mantidproject.org/VatesSimpleInterface, show the workspace, which has been converted to MD TOPAZ_3132_MD2. Switch to Splatter Plot Mode and increase the number of MDEvents. You might want to Add more MDEvents, or scale the colour range so you can see the Bragg peaks.
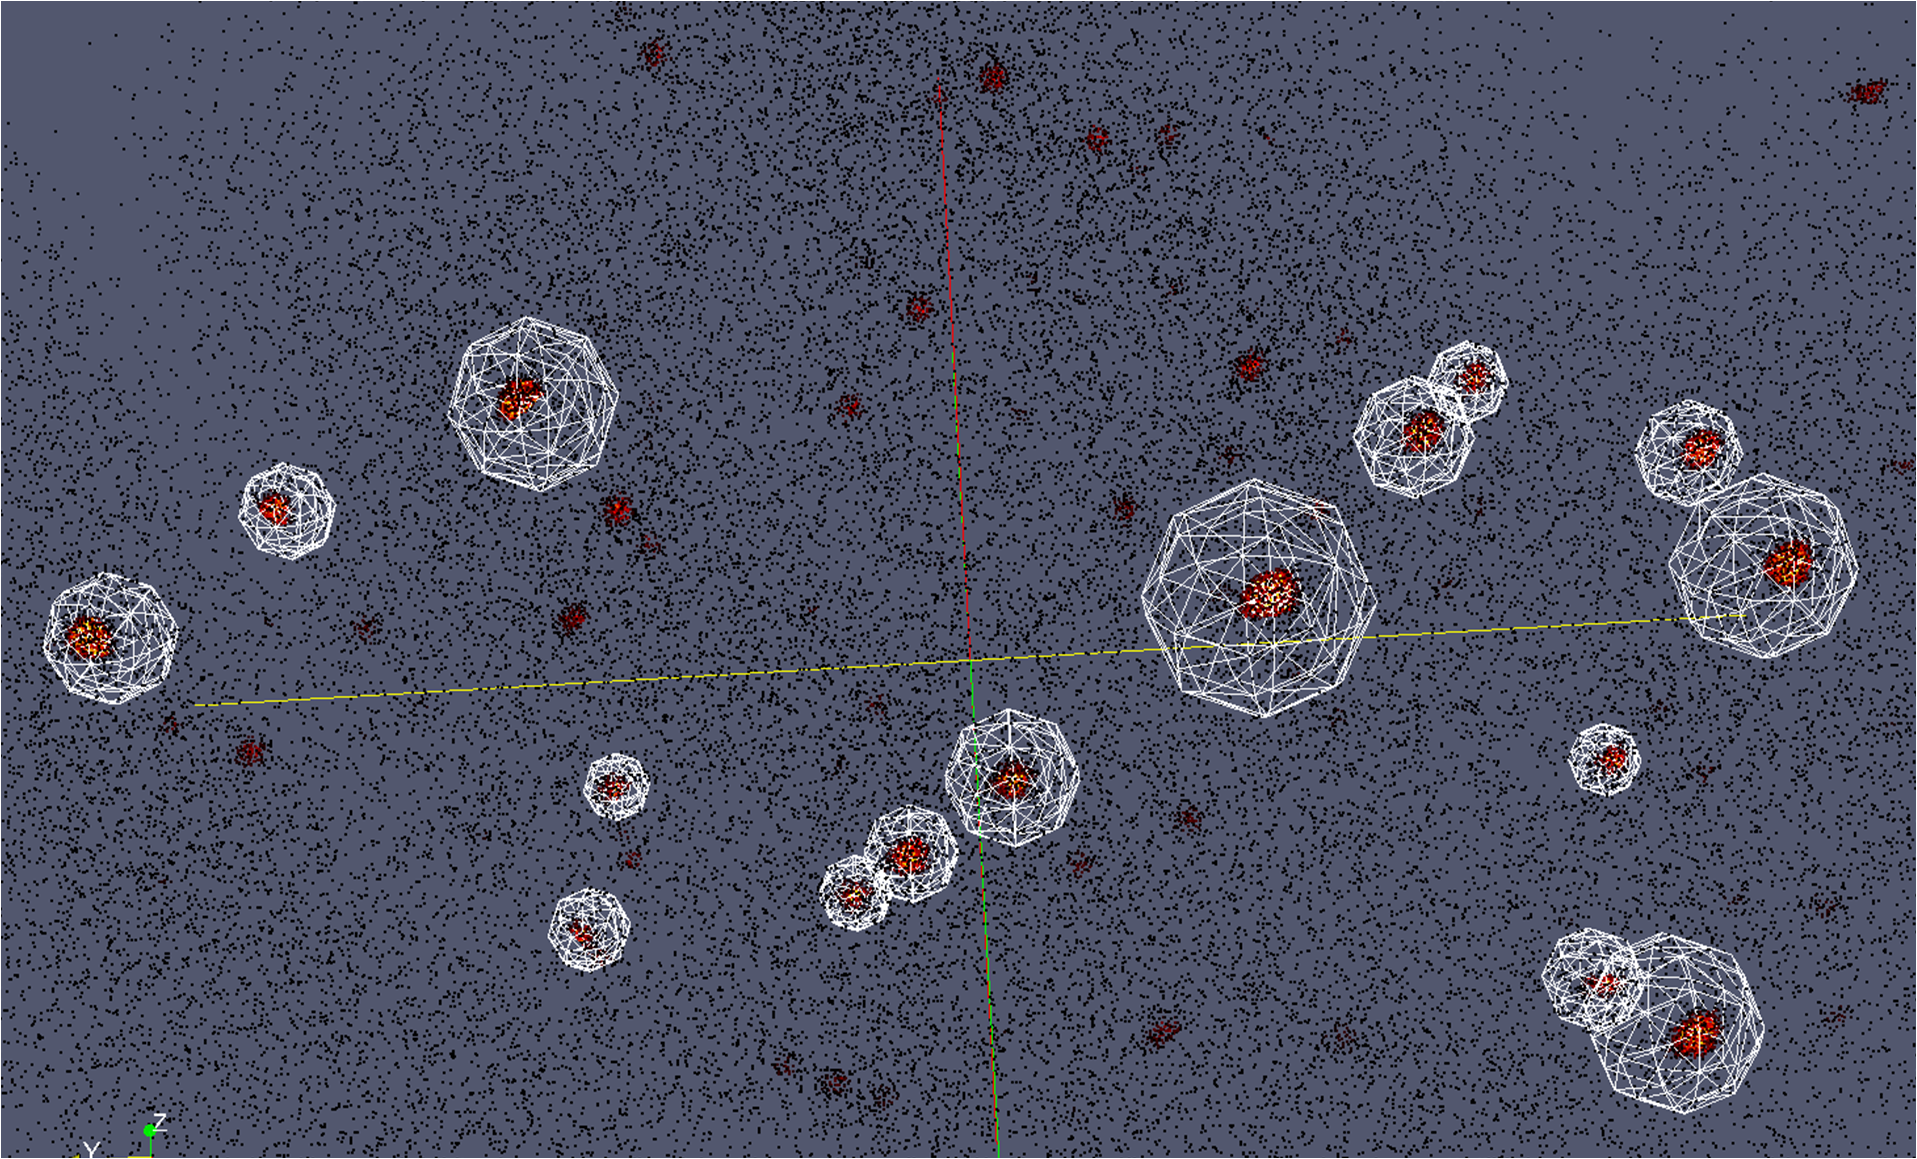
3) Right-click, the IntegratePeaksMD output PeaksWorkspace and show in the VSI. This should overlay the PeaksWorkspace on the splatter plot, showing peaks as spheres. The radius of the spheres are the PeakRadius used in IntegratePeaksMD. See attached file for example output.
4) Re-run steps 1-3, but adjust the script to notably change the PeakRadius, it should be possible to see this on the Peaks spheres.
5) Note that changing the Peak Radius in the properties tab of the VSI and hitting 'Apply', will NOT change the peaks radius for PeaksWorkspaces that have been integrated in this manner.
# Basic parameters  for  Triphylite Crystal
#Name of the workspaces to create
ws = "TOPAZ_3132"
filename = ws+"_event.nxs"
LoadEventNexus(Filename=filename,OutputWorkspace=ws,FilterByTofMin='3000',FilterByTofMax='16000')

# Load optimized DetCal file
#LoadIsawDetCal(InputWorkspace=ws,Filename="/SNS/TOPAZ/shared/Spectra/TOPAZ_8Sept11.DetCal")

# Spherical Absorption and Lorentz Corrections
AnvredCorrection(InputWorkspace=ws,OutputWorkspace=ws,LinearScatteringCoef="0.451",LinearAbsorptionCoef="0.993",Radius="0.14")

# Convert to Q space
ConvertToDiffractionMDWorkspace(InputWorkspace=ws,OutputWorkspace=ws+'_MD2',LorentzCorrection='0',
        OutputDimensions='Q (lab frame)', SplitInto='2',SplitThreshold='150')
# Find peaks (Reduced number of peaks so file comparison with reference does not fail with small differences)
FindPeaksMD(InputWorkspace=ws+'_MD2',MaxPeaks='20',OutputWorkspace=ws+'_peaksLattice')
# 3d integration to centroid peaks
CentroidPeaksMD(InputWorkspace=ws+'_MD2',CoordinatesToUse='Q (lab frame)',
        PeakRadius='0.12',PeaksWorkspace=ws+'_peaksLattice',OutputWorkspace=ws+'_peaksLattice')
# Find the UB matrix using the peaks and known lattice parameters
FindUBUsingLatticeParameters(PeaksWorkspace=ws+'_peaksLattice',a='10.3522',b='6.0768',c='4.7276',
               alpha='90',beta='90',gamma='90', NumInitial='20', Tolerance='0.12')
# And index to HKL
IndexPeaks(PeaksWorkspace=ws+'_peaksLattice', Tolerance='0.12')
# Integrate peaks in Q space using spheres
IntegratePeaksMD(InputWorkspace=ws+'_MD2',PeakRadius='0.12',
        BackgroundOuterRadius='0.18',BackgroundInnerRadius='0.15',
        PeaksWorkspace=ws+'_peaksLattice',OutputWorkspace=ws+'_peaksLattice')
comment:7 Changed 8 years ago by Owen Arnold
refs #6211. Extract and pass through peak radius.
Changeset: ef50e80b04969bde79adc2895a9ad70691c9f53a
comment:8 Changed 8 years ago by Owen Arnold
refs #6211. PV Plugins use Integrated Radius and show Spheres.
Changeset: 167f78b20f1522acedff63f69b761d23b104755e
comment:9 Changed 8 years ago by Michael Reuter
- Status changed from verify to verifying
- Tester set to Michael Reuter
comment:10 Changed 8 years ago by Michael Reuter
- Status changed from verifying to closed
This seems to be working correctly.
comment:11 Changed 5 years ago by Stuart Campbell
This ticket has been transferred to github issue 7057