Ticket #7747 (assigned)
Counter intuitive behaviour on 1D plots
| Reported by: | Stuart Campbell | Owned by: | |
|---|---|---|---|
| Priority: | major | Milestone: | Backlog |
| Component: | GUI | Keywords: | |
| Cc: | Blocked By: | ||
| Blocking: | Tester: |
Description
Email from Jen Niedziela <niedzielajl@…>
Hi Stuart,
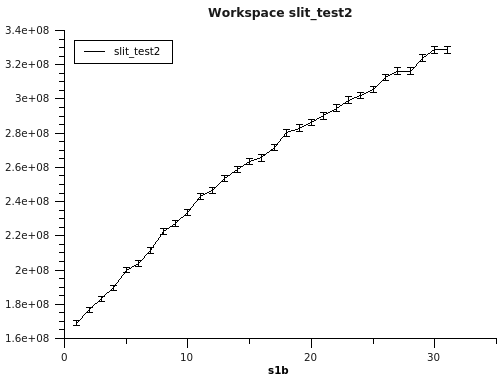
I ran into something this afternoon that seems a little counter-intuitive. I was attempting to plot the result of a repeated filtering of data based on a log value, but when I tried to plot the data, I got nothing. What was occuring is that every time I would load the file, the x-axis would be automatically set to 0 on both the min and max values. I only noticed this when I was trying again over the nxservice, and the plot was generated slowly enough I saw that the data plotted, but then somehow disappeared. I attach both the data file and the resultant plot I was eventually able to create.
It seems like this should be fixed - the default behavior should be to set the x-axis limit to the x value limits, at least for 1-d plotting. It would at the very least be less confusing.
Cheers, Jen